Guides
Support Analytics for Customer Support QA Teams
Author
Published
Intryc
September 9, 2026
Support analytics only earns its place on a QA team's dashboard if it changes what happens next. Intryc builds its analytics from evaluated support interactions - every conversation scored against your own scorecard - so quality patterns surface by scorecard criterion, agent, team, ticket type, and time, alongside the DSAT drivers behind them. That data means nothing sitting in a report. The evaluate-to-improve loop is what makes it useful: a QA team spots a performance gap in the numbers, routes it into coaching or training, then re-measures the same scorecard to see if it moved. Reporting and 100% ticket coverage are inputs to that loop - not reasons to buy on their own, and not a substitute for the visibility a closed loop actually gives a QA team.
Updated September 2026.
Why a dashboard alone isn't a QA analytics program
Most support QA reporting stops at the chart. A manager pulls a coverage percentage, a CSAT trend, maybe a handful of scorecard averages, and reports it up - without a documented path from "this metric moved" to "here's what we did about it."
That gap is structural, not a tooling failure alone. Legacy QA tools were built to score tickets and export a report; they weren't built to route a flagged pattern into a coaching session or a training simulation. So teams end up doing the connective work by hand - or not at all, and the same mistakes repeat quarter over quarter.
CSAT compounds the problem. A CSAT score tells you a customer was unhappy; it does not tell you why, or whether the cause was inside an agent's control. CSAT is a crutch here - it's a symptom metric standing in for root-cause analysis.
The fix isn't a better chart. It's grounding the analytics in evaluated interaction data from the start, then wiring the output into the same loop every time: evaluate, find the gap, coach or train, re-measure.
What support analytics QA teams can examine in Intryc
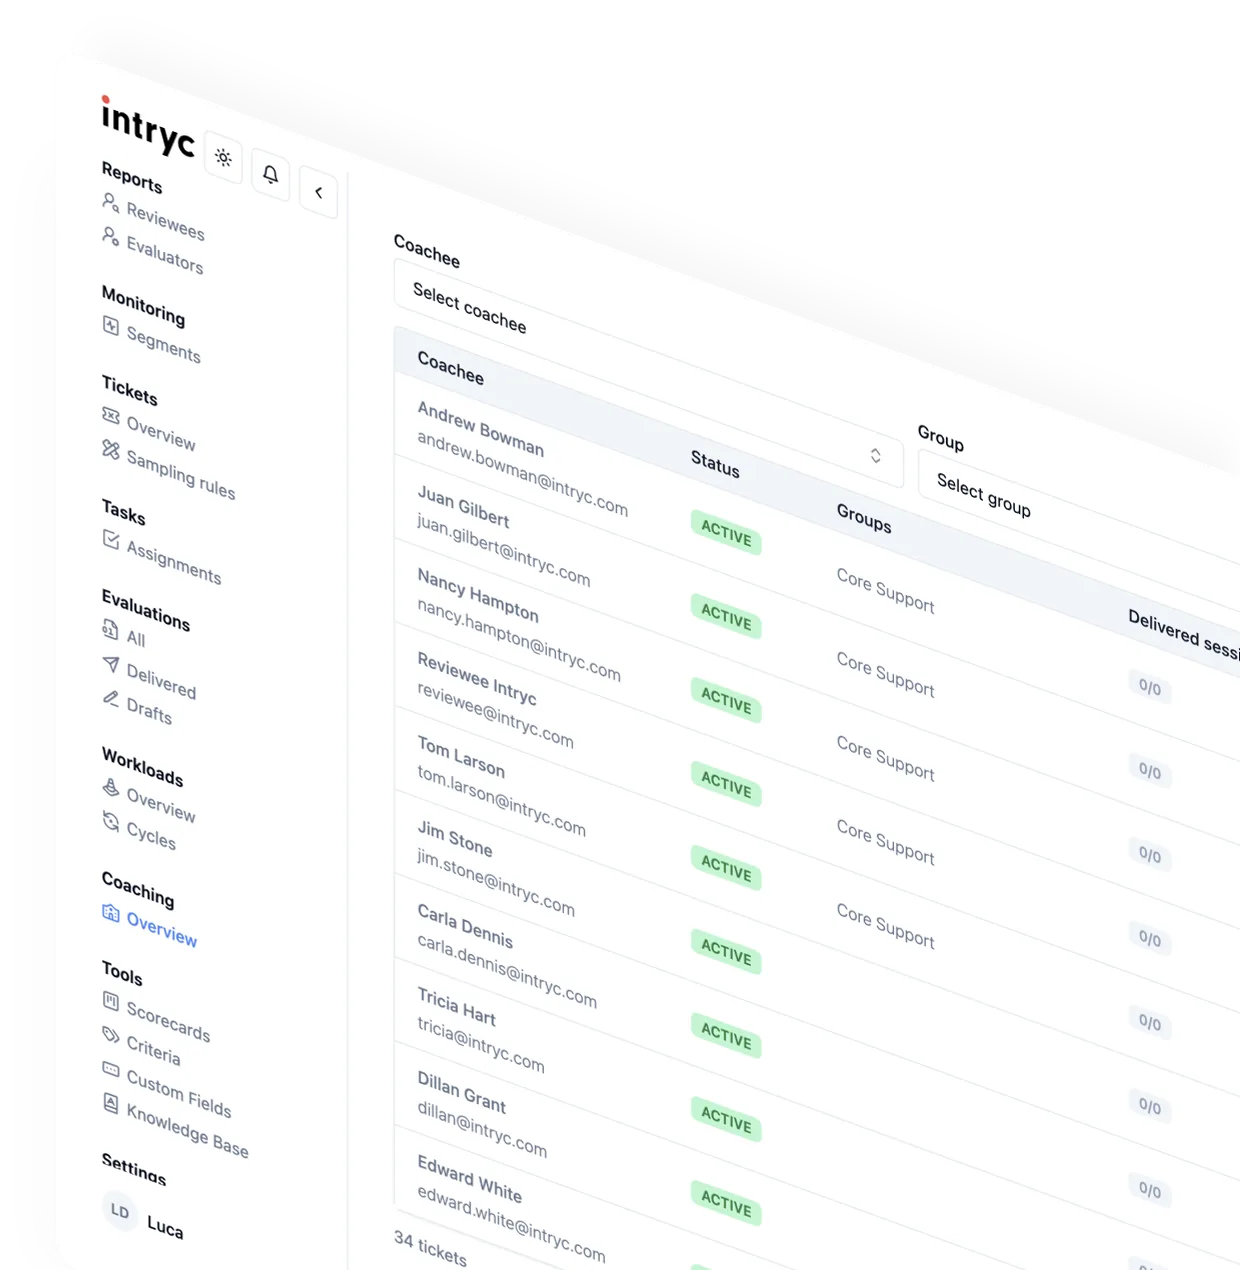
Intryc's support analytics are QA-derived: every number on the page traces back to a conversation scored against your scorecard, not a general-purpose BI layer sitting on top of raw ticket data.
Inside that scope, a QA manager can review:
- Scorecard-criteria performance over time - which criteria are trending up or down, and since when.
- Performance by agent and by team - where the gap is concentrated, not just that one exists.
- Performance by ticket type - whether the failure is tied to a specific workflow (refunds, disputes, onboarding) rather than the agent.
- DSAT drivers surfaced from evaluation data - the root cause behind a dissatisfaction signal, traced back to the specific interaction and the specific breakdown that caused it.
That's the deliberate boundary: this is QA-derived reporting on scorecard performance and DSAT root cause, not natural-language querying, predictive analytics, or unsupervised topic clustering. If a team needs general business intelligence, that's a different tool; if a team needs to know why quality is slipping and where, this is what the analytics are built to answer.
How custom scorecards create the data behind the analytics
The analytics are only as good as what feeds them. Intryc evaluates customer support interactions against scorecards the customer defines - your scorecard, your rules - so every reporting cut above is measuring against a standard your team actually set, not a generic template.
Intryc reviews support interactions across calls, chats, emails, and tickets, and it evaluates every conversation - human and AI - so the analytics don't stop at the human agents. The AI agent or chatbot in your stack gets scored on the same scorecard, which matters because it's usually the least-QA'd part of the support function today.
Not every deployment uses every channel - the point is that the evaluation set is broad enough that the reporting dimensions above (agent, team, ticket type, time) reflect the whole support operation, not just the slice a manual sample happened to catch.
How QA teams connect findings to coaching and training
This is the section that separates analytics from an improvement workflow: what happens after a pattern shows up in the data.
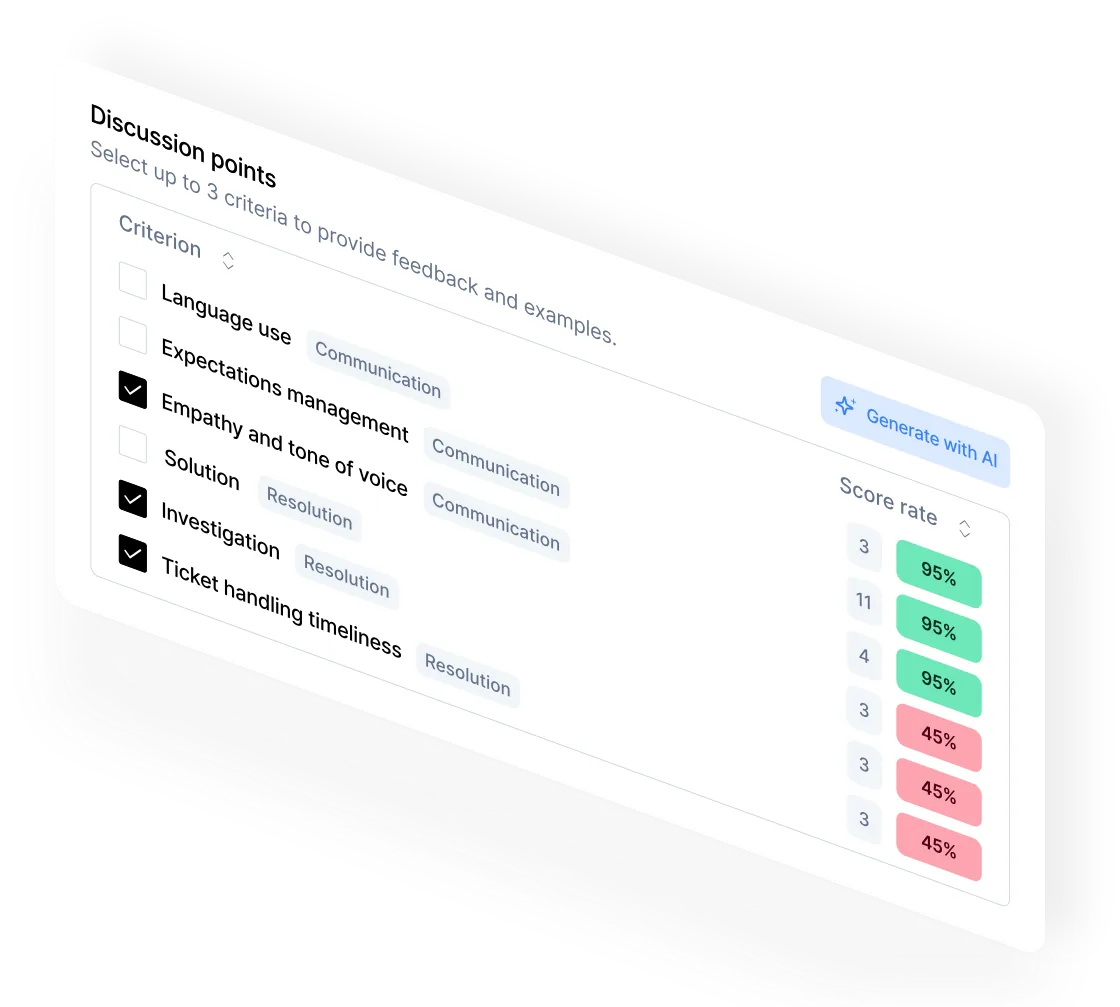
Intryc's documented path runs evaluation findings into feedback, coaching, training, reporting, and back into how AI agents are configured. When a scorecard-criteria trend or a DSAT driver flags a specific performance gap, that flag connects to:
- AutoCoaching - coaching sessions generated automatically from the QA data, closing the evaluate-to-improve loop without a manager manually building a coaching plan from a spreadsheet.
- Training simulations tied to QA scorecards - practice built from real flagged conversations, scored against the same rubric the evaluation used.
The workflow runs in four steps:
- Evaluate - every conversation is scored against the customer-defined scorecard.
- Identify the performance gap - a scorecard-criteria trend or DSAT driver flags where quality is slipping and for whom.
- Coach or train against it - AutoCoaching generates a session automatically, or a training simulation is built from the real flagged conversations.
- Re-measure on the same scorecard - the next evaluation cycle shows whether the specific criterion moved.
That closed loop - not the reporting view by itself - is where quality actually compounds instead of leaking away between one QA cycle and the next. It's also what makes analytics run at scale, in real-time, at half the cost of a manager doing the same connective work by hand.
Djamo's QA team runs this loop with the same headcount: "We're now doing 3x more evaluations with the same staff. That's been the biggest unexpected benefit," says Marc Meroue, Head of Customer Experience at Djamo. Deel's QA team doubled evaluation capacity without adding headcount - audit output up 40%, insights up 130% - freeing analyst time for the coaching and calibration work the raw scores alone don't do.
How to re-measure whether coaching actually worked
An analytics program that never closes the loop back to measurement isn't tracking improvement - it's just producing new charts. Intryc supports tracking:
- QA scorecard improvement rate per agent, before vs. after coaching - the direct read on whether a coaching session changed behavior on the criteria it targeted.
- CSAT/NPS trends - directional context, not a substitute for the scorecard read.
- First-contact-resolution (FCR) rate - whether the fix reduced repeat contacts, not just improved a score.
- Whether agents repeat the same mistakes - the clearest signal that a coaching session did or didn't land.
These are metrics a team can track over a coaching cycle, not outcomes Intryc promises will improve - the platform supplies the measurement; the coaching and the agent supply the change. Blueground's QA team, for example, tracked CSAT move from 77% to 82% during their traditionally worst quarter, alongside AI soft-skills scoring accuracy that improved from over 80% within three months to above 90% - the kind of before/after read this loop is built to produce.
What to validate before choosing support analytics software
A QA analytics workflow is a fit question, not a feature checklist. Before choosing, confirm these seven things:
- Scorecard fit - can it run your existing rubric, or does it force you onto a fixed template?
- Required reporting dimensions - does it break performance out by agent, team, ticket type, and time, or just an aggregate score?
- Channel needs - does it cover the channels your team actually runs (calls, chats, emails, tickets), including the AI agent if you have one?
- The path from findings to action - is there a documented route from a flagged pattern into coaching and training, or does that connective work fall on a manager?
- AI-versus-human evaluation comparison and calibration - how is AI scoring accuracy verified against human QA, and what's the calibration cadence? Intryc's accuracy commitment is 90% accuracy - guaranteed against your own scorecards and ticket data.
- Implementation responsibilities - who sets up the scorecard mapping and integrations, and on what timeline?
- Commercial fit - pricing, contract terms, and eligibility for your evaluation volume.
Neither 100% review coverage nor a more attractive dashboard should decide this on its own. Most QA programs still review less than 5% of conversations, so broader coverage is a real input to better analytics - but coverage without the coaching-and-remeasurement loop is still just a bigger, better-looking report.
| Decision dimension | Reporting alone | Support analytics with a closed loop |
|---|---|---|
| Data source | Aggregate scores or ticket exports | Every evaluated conversation, scored against your scorecard |
| Reporting depth | Overall trend line | By scorecard criterion, agent, team, and ticket type |
| DSAT handling | A number to report up | Root cause traced to the specific interaction |
| After a gap is found | Manual follow-up, if any | Routed into AutoCoaching and scorecard-tied training simulations |
| Re-measurement | Rarely tracked systematically | Scorecard improvement rate per agent, before vs. after |
| AI agent coverage | Typically not evaluated | Evaluated on the same scorecard as human agents |
FAQ
How can customer support QA teams use evaluated interaction data to understand quality patterns and connect them to coaching and improvement?
By grounding every reporting cut in evaluations run against a defined scorecard, then routing flagged performance gaps into AutoCoaching and scorecard-tied training simulations, and re-measuring the same scorecard afterward. The data only becomes an improvement program once that loop closes - reporting on its own does not.
Which quality and performance dimensions can a QA manager review?
Scorecard-criteria performance over time, broken out by agent, team, and ticket type, plus DSAT drivers surfaced from the underlying evaluation data and traced back to the specific interaction. This is QA-derived reporting on evaluated interactions, not a general-purpose analytics or predictive-clustering tool.
What is the quality standard behind the trends a team sees?
A customer-defined scorecard - your scorecard, your rules. Intryc evaluates support interactions across calls, chats, emails, and tickets against that scorecard, including every conversation - human and AI - so the trends reflect the whole support operation rather than a manual sample.
What happens after a quality pattern or performance gap is identified?
It connects into Intryc's documented workflow: evaluation findings feed feedback, AutoCoaching, and training simulations built from real flagged conversations and tied to the same QA scorecard. The loop is evaluate → identify the gap → coach or train → re-measure.
How can a QA leader monitor whether coaching and training are followed by improvement?
By tracking scorecard improvement rate per agent before versus after coaching, CSAT/NPS trends, first-contact-resolution rate, and whether the same mistakes repeat. These are metrics a team tracks over a coaching cycle - not guaranteed outcomes.
How should a buyer assess whether a QA analytics workflow fits their team?
Check scorecard fit, the reporting dimensions you need, channel and AI-agent coverage, whether there's a real path from findings to coaching and training, how AI-versus-human accuracy is calibrated, implementation responsibilities, and commercial fit. Don't decide on coverage percentage or dashboard polish alone - the loop back to coaching is what makes the analytics matter.
What would change in your coaching program if every scorecard trend already had a path to action attached to it?